Papal Pilgrimage, March 2000 |
|
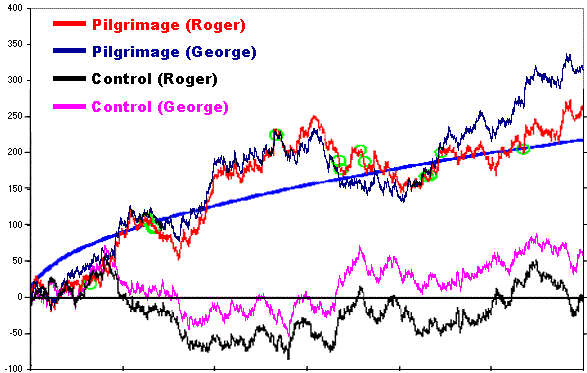
Pope John Paul II made his long wished-for historic pilgrimage to the Middle East from March 21 to March 26, 2000. He made stops in Jordan and Israel as he visited major biblical sites from the life of Jesus. Reinhilde Nelson made a general prediction: "The GCP should be looking at the Pope's visit. What he is doing really is a Global Event, and people around the world are paying attention. I think it helps us understand our common interest and makes it more believable that peace is possible. People listen, and cry because they are so grateful to hear such a clear message." The visit was six days long, from the 21st to 26th of March. Our original prediction assumed that we could get accurate timing for particular points in the Pope's trip, which then could be correlated with parameters of the synchronized time-series of nominally random egg data. News reports and the official descriptions gave only general timing information, so the primary assessment is based on the cumulative deviation of the normalized mean score across eggs, which is used for the standard evaluation of most GCP events. During the course of the visit, there was a fairly steady trend, culminating in a significant deviation over the six-day period. Chisquare is 8952 on 8640 df, which has a p-value of 0.009. The data are shown in the following figure, with a 5% (or 1 in 20) significance parabola in blue. Control data were taken from an arbitrarily chosen 6-day period 10 days later (31 March to 5 April). These show no trend, and culminate in Chisquare = 8630.0 on 8640 df, p = 0.528. Times for several of the Pope's meetings and speeches are indicated with green circles. The events are described below. (The original analysis was done in early April. An independent, confirmatory analysis by George deBeaumont was done in July, and is detailed following the event description.)
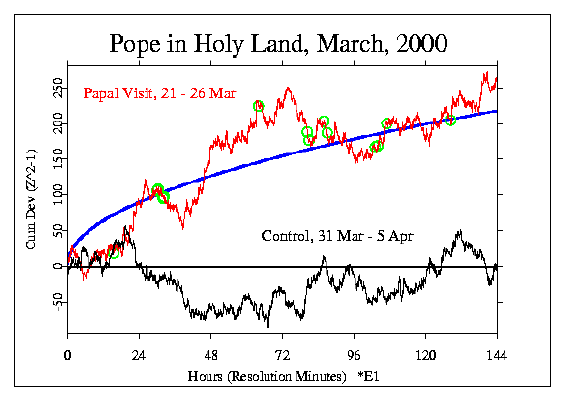
More precise times for various meetings and speeches have been provided by the Vatican Information Service, and this information can be added to the analysis, at least to note the moments in relation to the trend. The graph is in UTC time coordinates, while Israel is in UTC + 0200, so an event at 14:00 in Israel will correspond to 12:00 in the graph's time-line. The green circles on the cumulative deviation line are centered approximately on the times of the following events. 1. March 21, Arrival ceremonies, Tel Aviv - 5:30 p.m. local time 2. March 22, Visit to Jordan Valley, morning - shortly after 8 a.m. March 22, Bethlehem speech - The Pope spoke upon his arrival at about 8:30 a.m. He also gave a homily during Mass in Bethlehem: that Mass began at 10 a.m. - the homily would have been delivered within about a half hour of the start of Mass. 3. March 23, Meeting with Religious leaders, afternoon - Began about 5:45 p.m. Speech would have been 20 or so minutes later 4. March 24, Mass reflecting Sermon on the Mount, Galilee - Mass started late that day: scheduled for 10 it began about 10:30 or 11 a.m. March 24, Meeting with Barak, early afternoon - 4 p.m. March 24, Visits to the three churches, afternoon - Started about 4:45 or 5 p.m. 5. March 25, Visit to Nazareth - arrival shortly after 9 a.m; arrival at basilica of the Annunciation about 9:20, Mass in Nazareth started at 10; Pope left Nazareth just before 1 p.m. 6. March 26, Jerusalem's Western Wall - About 10:30 a.m. Confirmatory analysis, GdBIn mid-July, George deBeaumont took up the Papal visit event for an independent look. After clear communication of the detailed procedure, his analysis turned up a picture that was different, but had general similarity. He sent a figure, with accompanying commentary, which superimposed my analysis and his. On Thu, 20 Jul 2000, George deBeaumont wrote: > Roger, > > I worked some bugs out of the Visual Basic routines and re-ran the > Papal Pilgrimage data. Much better agreement...however :-( terminal > chi-square values differ: > > Roger Papal visit: 8896.4 x^2, 8640 df, p(.05) 0.026 > George Papal visit: 8952.3 x^2, 8640 df, p(.05) 0.009 > > Roger Control: 8630.0 x^2, 8640 df, p(.05) 0.528 > George Control: 8695.3 x^2, 8640 df, p(.05) 0.335 > > I've attached an overlay of the traces (pilgrimage03.gif). Perhaps > another egg reported in after your analysis? Or maybe I've still got > some faulty code :-( I sent the header information, and George compared the numbers of eggs with what he had extracted in July. The result is a clear indication that the differences are from additional eggs. The new data tended for most of the 6-day period to show the same positive deviation, so that the end result is even less probable, and would occur by chance less than once in one hundred repetitions of a similar occasion. Roger, Reporting eggs (yours & mine respectively) 3/21 26 29 3/22 25 28 3/23 24 28 3/24 24 28 3/25 25 28 3/26 25 27 Yep, it's the extra eggs driving the deviating traces! If you feel comfortable with my analysis, you may want to claim the p=0.009 significance for the current result summary. 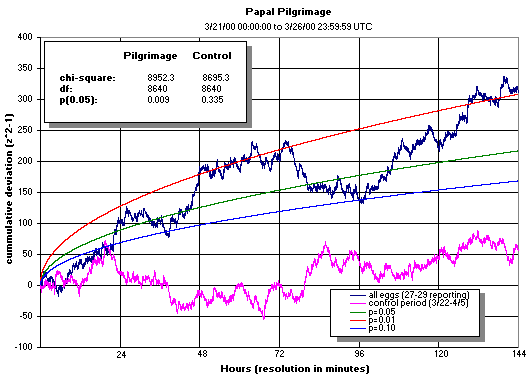
|