|
The primary analyses for New Years 2004-2005 are complete as
of January 2nd, 2005. All of the current array of active eggs have
reported as of this date, with 57 eggs archived on December 31 and 57 on
January 1.
During the course of 2004, a re-analysis of all formal events revealed a
mistake in the computations for all the New Year analyses. The matrix
manipulation used to signal average the timezones was incorrect, so the
results were of course in error. In the meantime I have set up a
calculation of the outcome with the old, incorrect method and the new,
correct method juxtaposed so a comparison can be made. This is the
format that is used for 2004-2005 results, below.
The formal analyses are based on the fully detailed data, with
1-second resolution. Although a few eggs are not synchronized to the
second, their mis-synchronization has only a conservative influence, so
all eggs are included in the analyses.
The composite across timezones specified for the last two years
is used again. (The procedure for the composite is
signal averaging like that used to reveal non-random structure in brain
electrophysiology, for example, in examining evoked potentials.)
A simple picture of time differences around the world assumes 24
timezones, but the formal analysis is based on
37 official timezones, from -14 to +12 hours from GMT, including 10
zones with half-hour offsets.
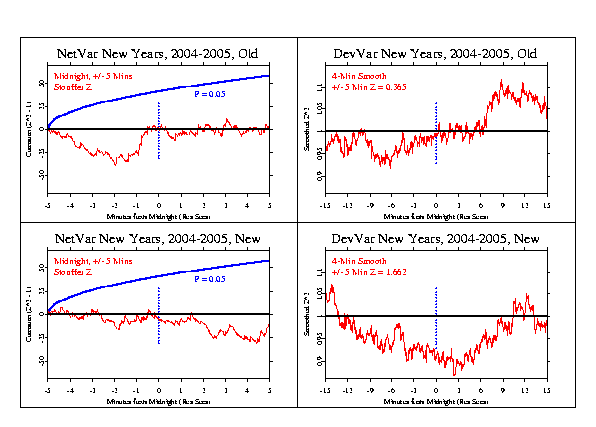
For the 10 minute period surrounding midnight, we make
two formal predictions. The first is for the squared Stouffer Z
(equivalent to Chisquare) across eggs, at seconds resolution, to show
a positive trend.
The following figure shows the data for this
prediction according to the old calculation and the new.
A blue envelope shows the 5% chance level over the time period for
comparison.
The second of the formal predictions
is for reduced variance near midnight on December 31.
To test it, the variance across eggs is normalized as Z-scores for each
second, then the sequence is smoothed and plotted.
Here, a longer period is plotted, but the 10 minute segment around
midnight is subjected to a permutation analysis to estimate the
likelihood of the magnitude and distance of the minimum from midnight.
The value in the legend and in the main table is,
however from a new, simpler calculation,
which is just the variance over all eggs and all seconds in the 10
minute period around midnight. The specified expectation is for a
reduction, and the sign of the Z-score in the table reflects this.
|